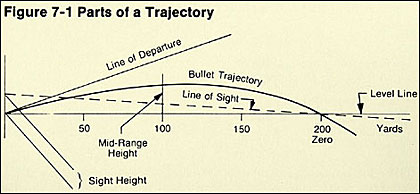
I always had trouble visualizing a rifle sighted in at, say, 100 yards shooting high at the shorter yardages. It's because of the disconnect for someone like me who has not shot much rifle, especially at distance. So on the normal graphs that show the bullet drop at 100 yards, the muzzle point is always above the impact point, or below it. Here is my rendition of the correct chart for the space-visualizing-impaired like me. Shooting a 308 on level ground zeroed at 100 yards - obviously not to scale.


")